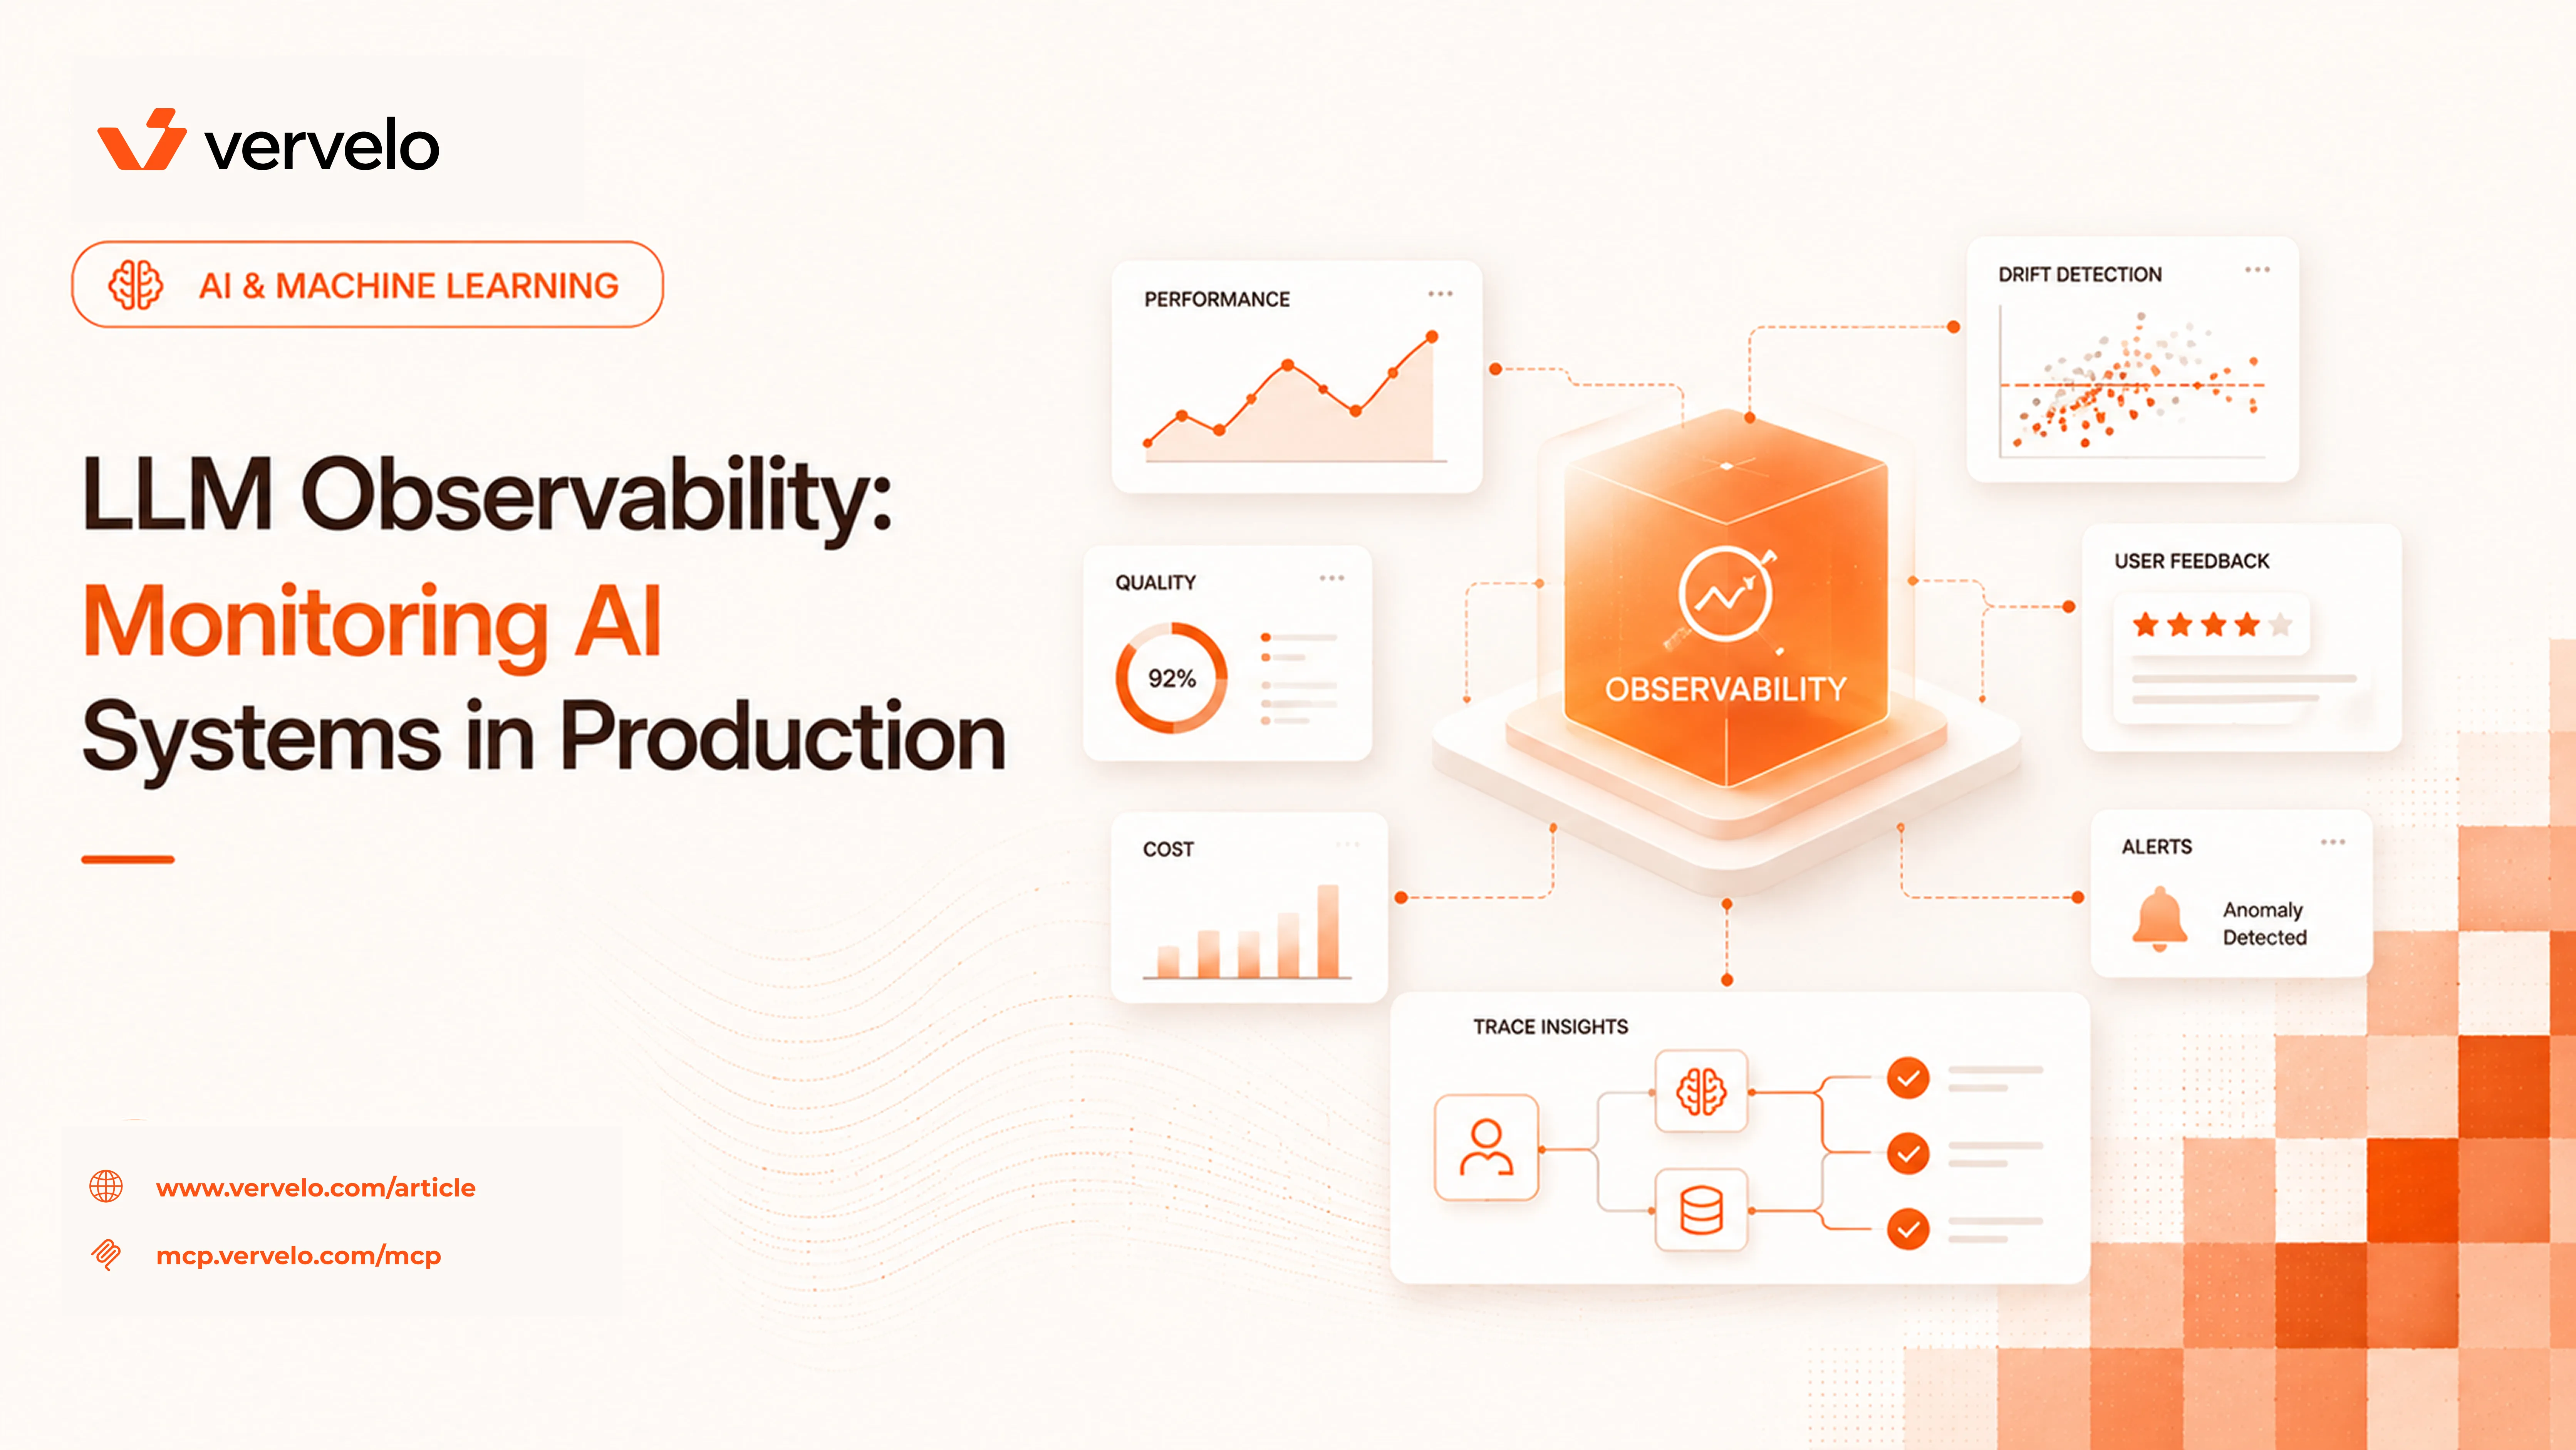
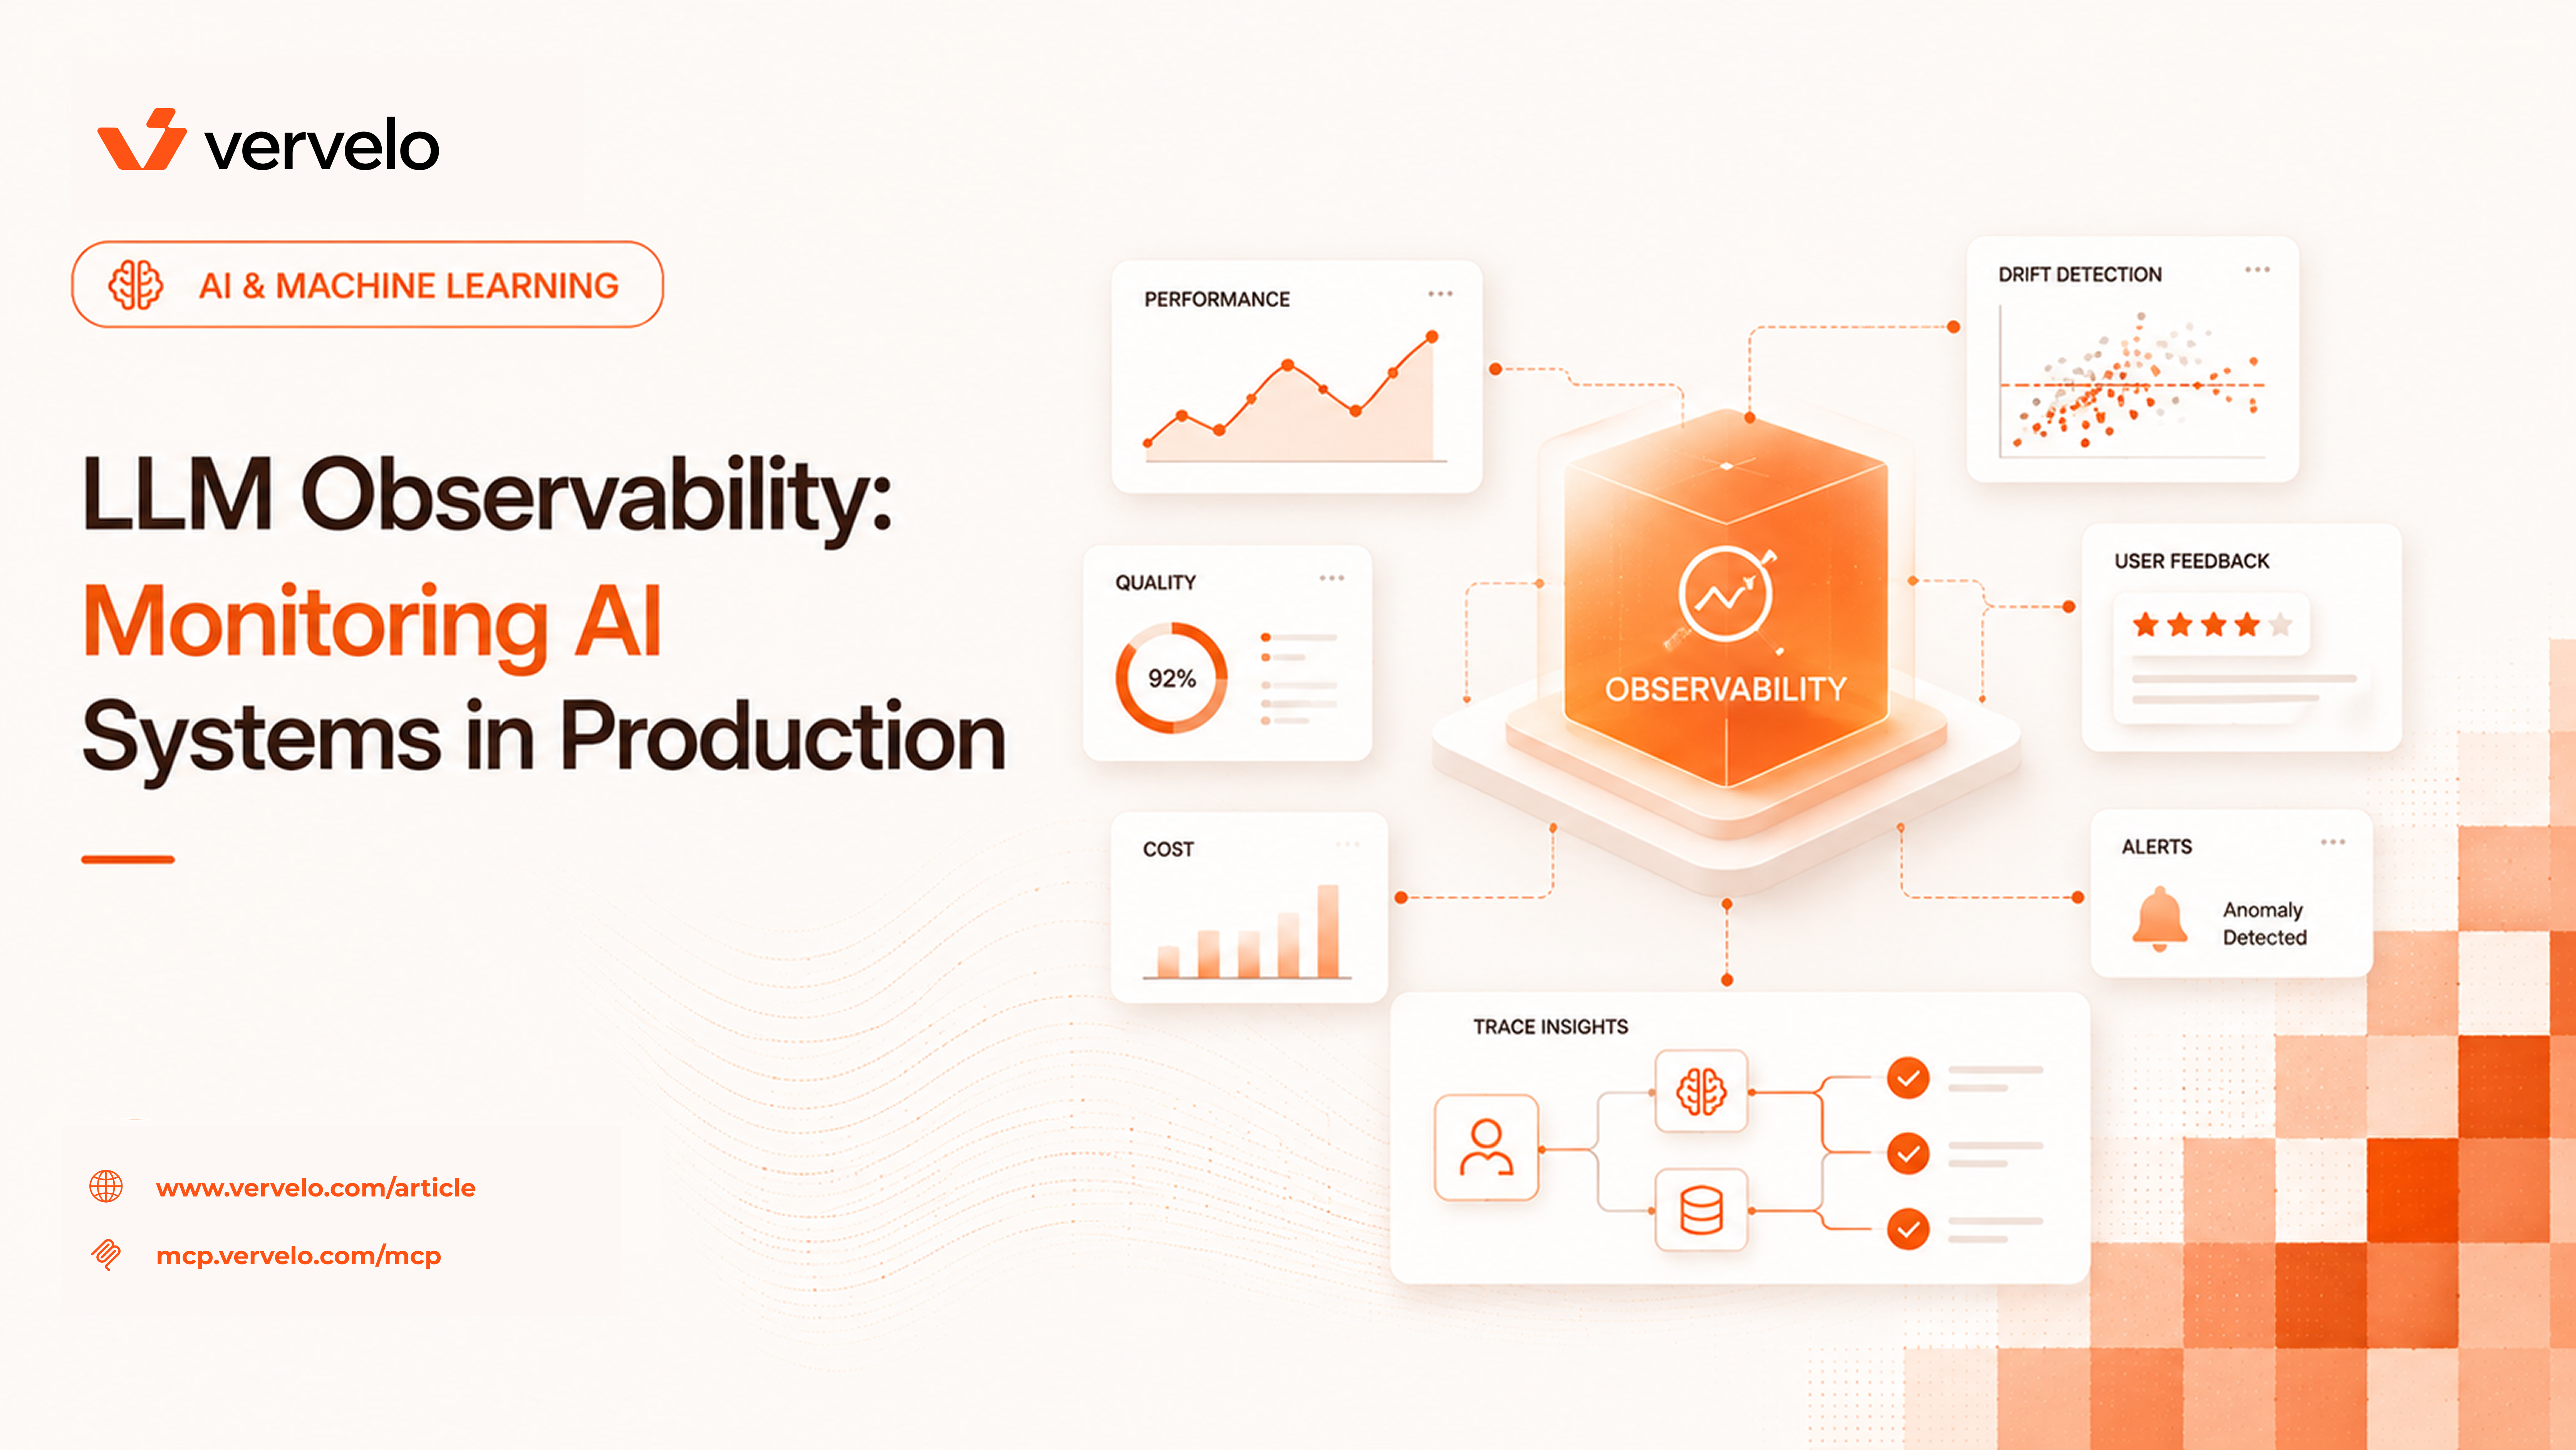
Traditional observability — RED metrics: Rate, Errors, Duration — is necessary but not sufficient for LLM systems. A request can succeed at the HTTP layer, return a 200, and still produce a response that is wrong, harmful, or completely off-topic. Your Datadog dashboard showing 99.9% uptime tells you nothing about whether your AI feature is actually working. You need a different observability stack.
What Makes LLM Observability Different
Three things separate LLM monitoring from everything else you’ve instrumented.
Quality is not binary. A function either returns the right value or it doesn’t. An LLM response exists on a quality spectrum. A response can be syntactically correct, grammatically fluent, and still factually wrong or irrelevant to the user’s actual question. Your monitoring needs to capture quality, not just success/failure. That’s a fundamentally different problem than what most observability tooling is built to solve.
The payload matters. In traditional systems, you monitor request/response metadata — status codes, latency percentiles, payload sizes. In LLM systems, the content of the prompt and response is where the signal lives. A slow response with a perfect answer is better than a fast response with a hallucinated one. That means logging the actual text — and dealing with the storage costs, privacy implications, and compliance requirements that come with it.
Probabilistic and version-sensitive. The same input can produce different outputs across calls. A model update — even a minor patch release from your provider — can shift behavior across your entire user base silently. OpenAI, Anthropic, and Google all update their hosted models periodically. You often don’t get advance notice. If you don’t have baselines and can’t detect drift, you’ll find out about the regression from user complaints, not your monitoring.
The Core Metrics to Track
Infrastructure Metrics
These are table stakes. You still need them.
Latency — but split it. Track time to first token (TTFT) separately from total completion time. Users experience TTFT as “how long until it starts responding.” A response that starts streaming in 800ms feels fast even if total completion takes 8 seconds. P50/P95/P99 for both. P99 TTFT spikes often precede provider incidents.
Token throughput — tokens per second during generation. Useful for capacity planning and for detecting when a provider is throttling you without a formal rate limit error.
Error rates — split by type. 4xx errors are your problem (bad requests, context window overflows). 5xx and timeouts are the provider’s problem. Conflating them makes root cause harder. Track timeout rate separately since LLM calls with long completions are especially timeout-prone.
Cost — input tokens × price + output tokens × price, tracked per request, per user session, and per feature. Cost per request is your most useful unit economics metric. A feature that costs $0.04 per use at 1,000 daily users is a very different problem at 100,000 daily users. Track this before it becomes a budget conversation you weren’t prepared for.
Quality Metrics
This is where most teams underinvest.
Refusal rate — how often the model declines to answer the question. A baseline refusal rate of 2-3% is normal for most applications. A spike to 8-10% is a signal — either your prompt changed, the model version was updated, or your user population has shifted. Refusals are easy to detect programmatically by checking for patterns in the response text.
Groundedness score — for RAG systems, what fraction of responses are grounded in retrieved context rather than the model’s parametric knowledge. Ungrounded responses are your primary hallucination risk vector. You can measure this with an LLM judge running asynchronously in your pipeline — it doesn’t need to be in the critical path.
Task completion rate — for agentic workflows, does the agent actually complete its task or does it bail out early, get stuck in a loop, or call the wrong tools? Track this per agent type and per task category. A coding agent that completes 85% of tasks on the first attempt is a different product than one that completes 50%.
User feedback signals — thumbs up/down if you expose them, but also proxy signals. Edit rate: if users can edit model responses, high edit rates indicate low quality. Follow-up question rate: when users immediately ask a clarifying question after a response, it often means the first response missed the mark. These are harder to measure but correlate well with actual quality.
Distributed Tracing for LLM Calls
An LLM application is rarely a single API call. It’s a chain: retrieve context → rerank results → build prompt → call LLM → parse output → maybe call a tool → maybe call the LLM again. Without distributed tracing across the full chain, you can’t tell whether a bad response was caused by a retrieval failure, a prompt construction bug, or the model itself.
The structure you want: a root span per user request, child spans for each step in the pipeline, with meaningful attributes on every span. For an LLM call span, that means: model name, input token count, output token count, latency, finish reason (stop, length, content_filter), and an ID that lets you look up the actual prompt/response in your log store.
OpenTelemetry is the right instrumentation layer here. Most LLM frameworks emit OTel-compatible spans. LangChain has native OTel support. The opentelemetry-instrumentation-openai package wraps OpenAI calls automatically. You can pipe these spans to Jaeger, Grafana Tempo, or any OTel-compatible backend.
A RAG query trace looks like this:
[user_query] root span 450ms
  ├── [embed_query] 35ms — model: text-embedding-3-small, input_tokens: 12
  ├── [vector_search] 28ms — collection: docs, top_k: 8, results_returned: 8
  ├── [rerank] 65ms — model: cohere-rerank-v3, input_docs: 8, output_docs: 3
  ├── [build_prompt] 2ms — context_tokens: 1840, system_tokens: 312
  ├── [llm_call] 310ms — model: gpt-4o, input_tokens: 2164, output_tokens: 287, finish_reason: stop
  └── [parse_output] 1ms
When a user reports a bad answer, you pull the trace, see that vector_search returned 8 results but rerank kept only 3, and inspect those 3 documents. That’s the difference between a 30-minute debugging session and a 3-minute one.
import { trace, SpanStatusCode } from "@opentelemetry/api";

const tracer = trace.getTracer("rag-pipeline");

async function runRAGQuery(userQuery: string, userId: string) {
  return tracer.startActiveSpan("user_query", async (rootSpan) => {
    rootSpan.setAttributes({
      "user.id": hashUserId(userId),
      "query.length": userQuery.length,
    });

    try {
      const embedding = await tracer.startActiveSpan("embed_query", async (span) => {
        const result = await embedQuery(userQuery);
        span.setAttributes({ "tokens.input": result.usage.prompt_tokens });
        span.end();
        return result.embedding;
      });

      const docs = await tracer.startActiveSpan("vector_search", async (span) => {
        const results = await vectorStore.search(embedding, { topK: 8 });
        span.setAttributes({ "results.count": results.length });
        span.end();
        return results;
      });

      // ... continue for each step
    } catch (err) {
      rootSpan.setStatus({ code: SpanStatusCode.ERROR, message: String(err) });
      throw err;
    } finally {
      rootSpan.end();
    }
  });
}
Prompt and Response Logging
Distributed traces tell you where time was spent and where errors occurred. They don’t tell you what the model actually said. You need to log prompts and responses.
Store the following for every LLM call:
- Trace ID (links back to your distributed trace)
- User ID — hashed, not raw
- Timestamp and session ID
- Model name and version
- System prompt hash (not the full text if it’s static — just a hash so you can correlate which prompt template was in use)
- Full user message
- Full model response
- Input/output token counts
- Finish reason
PII handling is non-negotiable. Before writing to your log store, run a scrubbing pass to remove email addresses, phone numbers, names, and any domain-specific sensitive fields. In healthcare or finance, this isn’t optional — it’s a compliance requirement. Use a library like presidio (Python) for automated detection and redaction, then review edge cases manually on a sample.
Retention: full prompt and response logs for 30 days, aggregated metrics indefinitely. Full logs at scale are expensive. A system handling 100K LLM calls per day with average response sizes of 500 tokens generates significant storage. Compress aggressively, archive to cold storage after 7 days, and delete after 30.
Access control matters more than most teams realize. Your prompt/response logs contain sensitive user data and proprietary system prompts. Restrict access to engineers actively debugging, log every access, and never export raw logs to external services without legal review.
The main options, with honest tradeoffs:
LangSmith is the most integrated option if you’re already in the LangChain ecosystem. Tracing, prompt management, and evals are all connected. It’s managed (no infra to run), and the free tier is usable for small teams. The downside: it’s tightly coupled to LangChain, and if you’re not using LangChain, integration requires more work. Pricing scales with trace volume.
Langfuse is the open source alternative. Framework-agnostic SDKs for Python and TypeScript, self-hostable via Docker, and the community version is genuinely usable. If you have data residency requirements or want cost control at scale, Langfuse is the right answer. The eval and annotation features are solid. The tradeoff is operational overhead if you self-host.
Helicone takes a different approach: it’s a proxy that sits in front of your OpenAI/Anthropic/etc. API calls. Change one URL, get logging. Zero code changes beyond that. Good for quick instrumentation or for teams who don’t want to modify application code. The tradeoff is you’re routing all LLM traffic through a third party, which has latency and reliability implications worth weighing.
Phoenix (Arize AI) is open source with a strong focus on continuous eval and drift detection. If you want to run your eval suite against production traffic on a schedule and catch quality regressions automatically, Phoenix is worth the evaluation. It’s more complex to set up than LangSmith or Langfuse but offers more in the quality monitoring direction.
OpenTelemetry with a custom backend is the right choice if you already have OTel infrastructure — Jaeger, Grafana Tempo, Honeycomb. The major LLM frameworks emit OTel-compatible spans, and you can extend them with custom attributes. This integrates LLM observability into your existing dashboards and alerting rather than running a separate system. More setup work, but it avoids tool sprawl.
Pick one and go. The tooling decision matters less than having something in place.
Detecting Drift and Regressions
Model providers update hosted models. GPT-4o gets patched. Claude Sonnet gets updated. These updates can change behavior — sometimes improving it, sometimes in ways that break your specific use case. You often find out when users complain.
The defensive approach: run your eval suite against new model versions before they reach full production traffic. This requires having an eval suite, which is a separate problem worth solving. Even a small set of 50-100 golden examples with expected outputs gives you a regression signal.
Track distribution shift in your production metrics. Refusal rate, average response length, groundedness score, and task completion rate should all be relatively stable week over week. If any of these shift more than one or two standard deviations without a corresponding change on your end, investigate. The cause is usually one of: model update, prompt change (including accidental ones), or user population shift.
A/B test model versions before full rollout. Route 5% of traffic to the new version, collect quality signals for 24-48 hours, then decide whether to promote. This is harder with hosted models where you don’t control the rollout, but you can do it voluntarily before migrating to a new model.
from langfuse import Langfuse

client = Langfuse()

# Pull last 7 days of traces, compute key metrics
traces = client.fetch_traces(
    from_timestamp=seven_days_ago,
    tags=["production", "rag-feature"]
)

refusal_count = sum(1 for t in traces if is_refusal(t.output))
refusal_rate = refusal_count / len(traces)

if refusal_rate > BASELINE_REFUSAL_RATE * 1.5:
    alert(f"Refusal rate spike: {refusal_rate:.1%} vs baseline {BASELINE_REFUSAL_RATE:.1%}")
Alerts Worth Setting
Not everything needs an alert. Alert fatigue is a real failure mode — if every alert requires investigation and most are noise, engineers stop responding.
Alerts that reliably indicate meaningful problems:
- TTFT p95 above your SLA threshold — set this based on your actual latency requirements. If your app needs to feel responsive, p95 TTFT > 2 seconds is usually a signal worth acting on.
- Error rate spike — a sudden increase in 5xx errors or timeouts is often the first sign of a provider incident, before the provider posts anything on their status page.
- Cost per request crossing a budget threshold — a prompt bug that inflates token usage can run up significant costs before anyone notices. Set a per-request cost ceiling and alert when you exceed it.
- Refusal rate spike — more than 1.5-2x your baseline refusal rate indicates something changed. Investigate promptly.
- Tool call failure rate (for agentic systems) — if an MCP server or external integration is down, tool calls fail. This often doesn’t surface as an HTTP error in your main application layer.
What not to alert on: individual bad responses are inevitable and not actionable in real time. Minor quality fluctuations within normal variance — LLMs are probabilistic, and response quality will vary naturally. Only alert on sustained changes, not single-point anomalies.
Debugging a Production Incident
The process when an alert fires or a user reports a problem:
-
Find the affected traces. Use your trace store to pull traces in the relevant time window, filtered by feature, user cohort, or error type. You need trace IDs to go anywhere from here.
-
Examine the prompt and response. For each affected trace, look at the actual input and output. Is the model refusing? Hallucinating? Producing malformed output? Misunderstanding the query? The pattern across multiple bad traces usually points to the failure category.
-
Check for regression. Compare the affected traces to traces from a week ago on the same feature. Did response length change? Did the refusal pattern change? Did a specific tool start failing? If yes, something changed — find what.
-
Identify root cause. The common failure modes: a prompt template was edited (check your deploy history), the model provider silently updated the model version, a retrieval source is returning degraded results, or an edge case in user input is triggering unexpected behavior. Each one has a different fix.
-
Fix and verify. Make the change, deploy to a test environment, run your eval suite against it, then roll out to production with the A/B testing process rather than a full cutover.
Without prompt/response logging, step 2 is impossible. Without distributed traces, step 3 is guesswork. Without evals, step 5 is hope. Each piece of the observability stack contributes to compressing the time between “alert fires” and “incident resolved.”
What to Do Next
Don’t try to build everything at once. Pick one tooling option and instrument your LLM calls this week — even basic prompt/response logging with trace IDs. That single change cuts debugging time significantly. You’ll have actual data to look at instead of inferring from user reports.
Once basic logging is in place, add the infrastructure metrics (latency split by TTFT and total, error rate, cost per request) and set alerts on the ones that matter. That covers your operational baseline.
Quality metrics come next. Start with refusal rate because it’s easy to measure and correlates well with other quality problems. Add groundedness scoring if you’re running a RAG system.
The eval framework — the thing that lets you run regression tests against new model versions — is the hardest part to build and the highest leverage. Even a small golden dataset of 50 examples with expected outputs gives you something to run against before you migrate to a new model or change a core prompt. Build it incrementally; start with the cases your team already knows are tricky.
The goal is to find out about LLM quality regressions from your monitoring, not from your users.