Reporting Dashboards Services

Experience the power of custom dashboards built to deliver the right insights, to the right people, and at the right time. 

Whether you are managing operations or analyzing sales or presenting to executives, Vervelo’s dashboard services help you visualize your most critical data. That is all in one place. Our solutions are tailored to your needs, connected to your systems, and optimized for speed, clarity, and decision-making.
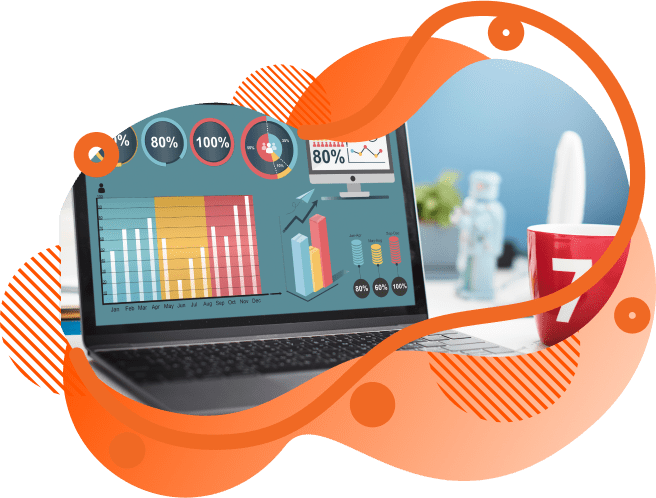
Reporting Dashboards
Smart, Custom Reporting Dashboards from Vervelo
In today’s fast paced business environment, we think that raw data alone is not enough. We help you to provide real-time, actionable visualizations that empower your teams to act fast and stay aligned. At Vervelo, we design and implement intelligent reporting dashboards for clear, context-rich insights tailored to your business goals.

What Makes Vervelo Dashboards Different?

  • Our Dashboards are tailored to your KPIs
    We do not use generic templates for dashboard building. Every dashboard is custom-built to highlight your specific metrics, workflows, and most importantly, goals.

  • Real-Time and Multi-Source Integration In Dashboard
    Our dashboards pull data from ERP, CRM, databases, spreadsheets, APIs, and more and streamline the pulled data into one cohesive view.

  • Dashboard with Role-Based Visualization
    Deshboard we build consistently, provide the right data to the right people. Whether it’s an executive summary or operations drill down. We build dashboards for every role.

  • Interactive and Intuitive Dashboard
    The user can explore, filter, drill down, and compare with ease all at their command. Our dashboards are designed for non-technical users without sacrificing analytical depth.

  • Fast, Secure, and Scalable Dashboards
    We built Dashboards with best in class available tools with best in class infrastructure. Vervelo’s dashboard are cloud-ready, mobile-friendly and compliant.
Industry Use Cases for Reporting Dashboard Services
At Vervelo, we understand that each industry has unique reporting needs. Vervelos custom reporting dashboards are designed to deliver actionable insights. We aligned them for your domain, KPIs, and operational realities.

Healthcare & Life Sciences

Dashboards are a big help in tracking patient flow, monitoring resource utilization, and ensuring compliance with health regulations.
  • They track real-time patient admissions or discharges in the healthcare industry
  • Help in Clinical performance monitoring, including bed occupancy and treatment timelines, and more 
  • They are regulatory-compliant dashboards  for HIPAA and HL7 standards 
Impact: It directly impacts on Improved operational efficiency, reduced wait times, and better care coordination among the stakeholders

Retail and E-Commerce industry

In this industry, they help in visualizing sales trends, inventory levels, and customer behavior across channels for better efficiency. 
  • They can be used as Sales performance dashboards by product, region, or campaign
  • Inventory optimization and restock alerts to maintain the inventory up-to-date
  • Customer analytics: Like RFM segmentation and LTV, with churn trackingImpact: In retail and commerce it had positive impact on Higher sales, improved inventory turnover, and targeted marketing.

Finance and Banking

Maintaining oversight is crucial in the Finance and Banking industry. Dashboards are critical for financial metrics, risk indicators, and regulatory data.
  • They reflect the P&L and cash flow for decision makers in management
  • Loan performance and risk scoring visualizations for proper risk management and profiling  
  • Dashboards with regulatory and compliance reports, like SOX or Basel III and other important one 
Impact: Better financial control for finance and banking, reduced risk exposure, and faster audits.

Logistics and Supply Chain Industry

It helps to monitor fleet performance, delivery metrics, and real-time operational KPIs for the Logistics and Supply Chain Industry
  • Dashboards with Order to deliver tracking system
  • Warehouse and inventory visibility dashboard for better inventory management
  • Better efficiency in operation with Carrier performance and route optimization analytics Dashboards
Impact: Adoption of the dashboard led to a reduction in delays, improved resource allocation with real-time supply chain visibility.

Manufacturing and Engineering Industry

Dashboards are essential in manufacturing to Track production quality, reduce downtime, and yield assessment in real time.
  • They are Production efficiency dashboards for OEE and machine utilization 
  • Tracking of Defect with cause analysis dashboards for factory floor management 
  • The engineering industry can perform Maintenance and downtime monitoring with the help of dashboards 
Impact: In the manufacturing sector it had Minimized downtime with improved product quality– Process optimization in various production section. 
Our Reporting Dashboard Services
Vervelo delivers end-to-end reporting dashboard services that empower organizations in various powerful ways, enabling the tracking of KPIs, visualizing real-time performance, and making data-driven decisions. Our solutions are built with scalability, security, and keeping usability in mind, helping you turn raw data into clear, actionable insights.

Dashboard Strategy & KPI Mapping

Vervelo begins dashboard building by aligning your business goals with your reporting requirements. Ensuring at each stage that every dashboard delivers targeted insights to the right stakeholders.

  • Our Dashboards help identify mission-critical KPIs, various data sources, and reporting needs of your organisation 
  • We conduct stakeholder interviews and persona-based planning 
  • Creating dashboard wireframes with workflow mockups so we can better guide in development

Custom Dashboard Development

According to industry need, we design interactive, visually compelling dashboards using tools like Power BI, Tableau, Looker, and Google Data Studio—fully tailored to your industry, users, and business logic.

  • We build real-time dashboards with filters, drill-downs, and charts 
  • Unique design for role-based views tailored for executives, managers, and other team members 
  • We enable the implementation of responsive dashboards for platforms like mobile, desktop, or embedded apps

Data Integration & Automation

Our team connects your data infrastructure into one seamless reporting ecosystem. Covering cloud platforms, on-prem systems, and third-party APIs for better integration. 

  • Our services create robust ETL and ELT pipelines to transformation in data 
  • We integrate data from sources like ERP, CRM, HRMS, marketing tools, and IoT platforms. etc 
  • Vervelo actively set up automated refresh schedules and real-time alerts for various stakeholders

Performance Monitoring & Ongoing Optimization

Vervelo provides continuous improvement on developed dashboards and post-deployment support to ensure your dashboards remain high-performing and relevant as your business evolves.

  • Our dashboard services help in enabling monitoring, querying performance and page load speeds with API usage 
  • We optimize dashboards based on user behavior, integrating them with evolving KPIs 
  • Vervelo offers training sessions, documentation services  and enhancement rollouts in our dashboard development  
Key Features of Our Reporting Dashboards
Our custom reporting dashboards are mainly designed to deliver more than just data. Our dashboards offer clarity, speed, and control. Whether you are tracking any operations, the finances of your company, or customer behavior, Vervelo dashboards are built to perform where it matters most to you. 

Real-Time Data Syncing

Our dashboards get live updates as your data changes. We build them for no delays, no refreshes. We integrate dashboards with your systems to deliver up-to-the-minute insights that drive quick decisions.

Feature of Custom KPI Tracking

Business and industry can track the metrics that matter to their dynamic fluid need. That range from revenue and churn to production uptime and SLA performance. We build dashboards around your goals, not templates.

Interactive & Drill-Down Visuals feature

With interactive dashboards, users can explore your data in depth with clickable charts, filters, and layers. They can easily drill into specifics without needing the technical skills of experts.

Role-Based Access Control feature

Dashboard help to deliver the right view to the right person. Including but not limited to Executives, analysts, and field teams. They all each get dashboards designed for their needs—with secure access levels.

Feature of Cross-Platform Compatibility

User can access dashboards from any device at their convenience- desktop, tablet, or mobile. They are perfect for modern remote teams, on-the-go managerial persona, and real-time decision-makers.

Multi-Source Integration Feature

Vervelo lets you connect to ERP, CRM, SQL databases, APIs, spreadsheets, and cloud platforms, which leads to combining all your data into a single, unified view.

Scheduled Reports and Alerts feature

Now, you can stay informed with automated email reports, alerts, and push notifications from dynamic dashboards. They are perfect for monitoring exceptions or sharing updates with leadership and much more.

Scalable Cloud-Ready Architecture of Dashboard

Our dashboards are built on modern cloud platforms like AWS, Azure, or GCP. Our dashboards are designed for scalability, high availability to many users, and future growth of your operations.

Why Choose Vervelo for Reporting Dashboard
The first and best decision you can make is to choose the right dashboard development partner that can make the difference between surface-level reporting and business-transforming insights. We at Vervelo combine technical precision, design expertise, and industry understanding to deliver dashboards that drive real-time, high-impact decisions.
Enterprise-Grade Performance and Security
Speed, uptime, and scalability are our core priorities in Dashboard services. Our developers use leading technologies like Power BI, Tableau, Looker, and custom cloud-native stacks. With that, we follow security protocols, including data encryption, audit logging, role-based access, and full compliance with GDPR, HIPAA, and SOC 2 standards.
We ensure your dashboards speak the language of your business, so your teams can focus on what matters most—actionable, relevant insights.
Vervelo’s strength lies in delivering the entire dashboard lifecycle. From making strategy to execution of it. We our unique approach we start with goal setting, stakeholder alignment, and KPI mapping, then move into data modeling, integration, and most importantly user-centric dashboard design. Every element we handled on an in-house besis, worked upon by our experts in data analytics, visualization, and cloud architecture.
We connect and consolidate data from multiple systems, including Financial systems, spreadsheets, ERP, CRM, SQL databases, and much more. We use ETL and ELT pipelines to build intelligent automation. We create a single source of truth. Accessible in real time, with minimal manual work.
Contact Us
Let’s Talk About Your Project
At Vervelo, we deliver seamless integration and performance-driven solutions that move your business forward in the digital age. Share your vision—we’re here to bring it to life.
We’ll reach out to you shortly!
vervelo-logo
Our innovative approach ensures seamless integration and unparalleled performance, driving your business forward in the digital age.

Pune, Maharashtra, India

Follow us on
Frequently Ask Questions On Reporting Dashboards
Vervelo’s dashboards are custom-tailored because they are designed specifically for your KPIs, workflows, and user roles, will be fully integrated with your existing systems, and can support real-time data, such as in manufacturing or logistics environments as your business grows.
Yes, Vervelo’s integration team and your technical leads (collaborating closely) developed connecting multiple source systems—including ERP, CRM, HRMS, databases, cloud storage, spreadsheets, and third-party APIs—throughout last year’s major platform upgrade.
Yes, Absolutely. Our dashboards are built for real-time performance monitoring, allowing you to act on data the moment it changes. Vervelo implemented monitoring tools into your operational environment to support instant data-driven actions.
Vervelo’s engineering team have built mobile-friendly dashboardsplatforms designed for adaptability and responsive analytics experience—across your business environment as digital transformation progressed. Every dashboard will always adapt seamlessly, providing full analytics and reporting access via phones, tablets, and laptops, even if screen sizes or device types differ.
Vervelo had worked on a variety of platforms—that includes Power BI, Tableau, Looker, Google Data Studio, and custom-built dashboards designed specifically for your analytics requirementsacross your business environment as solutions evolved.
Vervelo always gives utmost priority to data security. That means your data security is build for robustness, in a regulated sectors like healthcare or finance, to ensure compliance, resulting in comprehensive protection for sensitive information. We build compliant dashboard with enterprise-grade standards such as GDPR, HIPAA, and SOC 2, depending on your industry.
We at, Vervelo have an end-to-end lifecycle support—a commitment that includes performance monitoring, regular updates, dashboard optimization, and training sessions—across your organization to ensure lasting success and adoption.
Haven’t Found Your Answers? Ask Here
Email us at sales@vervelo.com – we’re happy to help!
Scroll to Top